Time and time again, I find myself needing to remember how to accurately reconstruct the frequency axis of an FFT in Matlab. This is one of the ways that I have documented as being a pretty close approximation of the frequency axis. This code will also properly compute the magnitude of each frequency component.
The code below uses the signal below as an example:
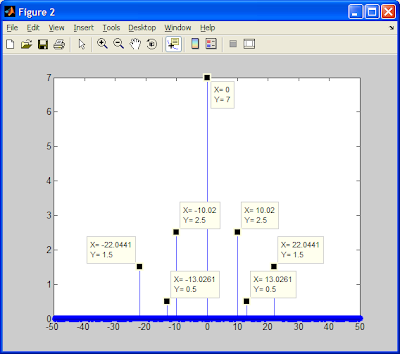
y=5*sin(10*2*pi*x)+3*sin(22*2*pi*x)+cos(13*2*pi*x)+7;
Now the Code:
Now the result:
Hope you find this useful.

I don't have matlab installed so I cannot verify... But I believe this also works for getting the frequency axis:
ReplyDeletedeltat = x(2)-x(1);
fmax = 1/(2*deltat);
deltaf = 1/(N*deltat);
f_axix = -fmax:deltaf:fmax;
Hi,
ReplyDeletejust in case someone still reads this. You can also go to the help of the "fft" command inside Matlab and check the example code at the bottom. This shows exactly how to do that.
Best
Martin